actinia.mundialis.de latest

The cloud based geoprocessing platform actinia is able to ingest and analyse large volumes of geodata already present in the cloud.
Due to its scalability of the cloud platform insights and tailor made information are delivered in near real-time.
actinia is free and open source software, available on GitHub.

Actinia in action

Web application

See how we use actinia in our web application with land surface temperature data

Actinia tutorial

Tutorial

Learn more about the concepts behind actinia and how to use it

Actinia workshop

Workshop

A detailed actinia workshop to get you started

Latest API documentation

Like swagger?

View actinia API docs in a nice style

Try it out

  1. Sentinel-2 NDVI
  2. Land Surface Temperature

NDVI of Sentinel-2

Let's calculate the NDVI for a Sentinel-2 Scene.

We can use the command line tool "curl" for this, but any HTTP GET and POST client will do. So open up a terminal and type:


curl -u 'demouser:gu3st!pa55w0rd' \
     -X POST \
     'https://actinia.mundialis.de/latest/sentinel2_process/ndvi/S2A_MSIL1C_20160818T032052_N0204_R032_T48LVP_20160818T032053'
            

Response:

click here to view

As this is an asynchronous request, you'll receive a status URL. Keep polling the status URL it, until the status is "finished":


                curl -u 'demouser:gu3st!pa55w0rd' \
                -X GET \
                'https://actinia.mundialis.de/api/v1/resources/demouser/resource_id-87c6ddf2-0911-4e16-95eb-a4ea466f18ac'
            

Then you will receive a long json response like this:

click here to view

You can see that the status is now "finished". The result can be seen in the "urls" section:


                "urls": {
                    "resources": [
                    "https://actinia.mundialis.de/api/v1/resource/demouser/resource_id-87c6ddf2-0911-4e16-95eb-a4ea466f18ac/tmpuvndd_n7.png",
                    "https://actinia.mundialis.de/api/v1/resource/demouser/resource_id-87c6ddf2-0911-4e16-95eb-a4ea466f18ac/ndvi.tiff"
                    ],
                    "status": "https://actinia.mundialis.de/api/v1/resources/demouser/resource_id-87c6ddf2-0911-4e16-95eb-a4ea466f18ac"
                },
            

Here you'll find a quicklook image in PNG format as well as the processed tiff. To download them, run:


                curl -u 'demouser:gu3st!pa55w0rd' \
                -X GET \
                'https://actinia.mundialis.de/api/v1/resource/demouser/resource_id-87c6ddf2-0911-4e16-95eb-a4ea466f18ac/tmpuvndd_n7.png' \
                > ndvi.png

                curl -u 'demouser:gu3st!pa55w0rd' \
                -X GET \
                'https://actinia.mundialis.de/api/v1/resource/demouser/resource_id-87c6ddf2-0911-4e16-95eb-a4ea466f18ac/ndvi.tiff' \
                > ndvi.tiff
            

And now you can look at them with e.g


                see ndvi.png
            

The quicklook will look like this:

ndvi

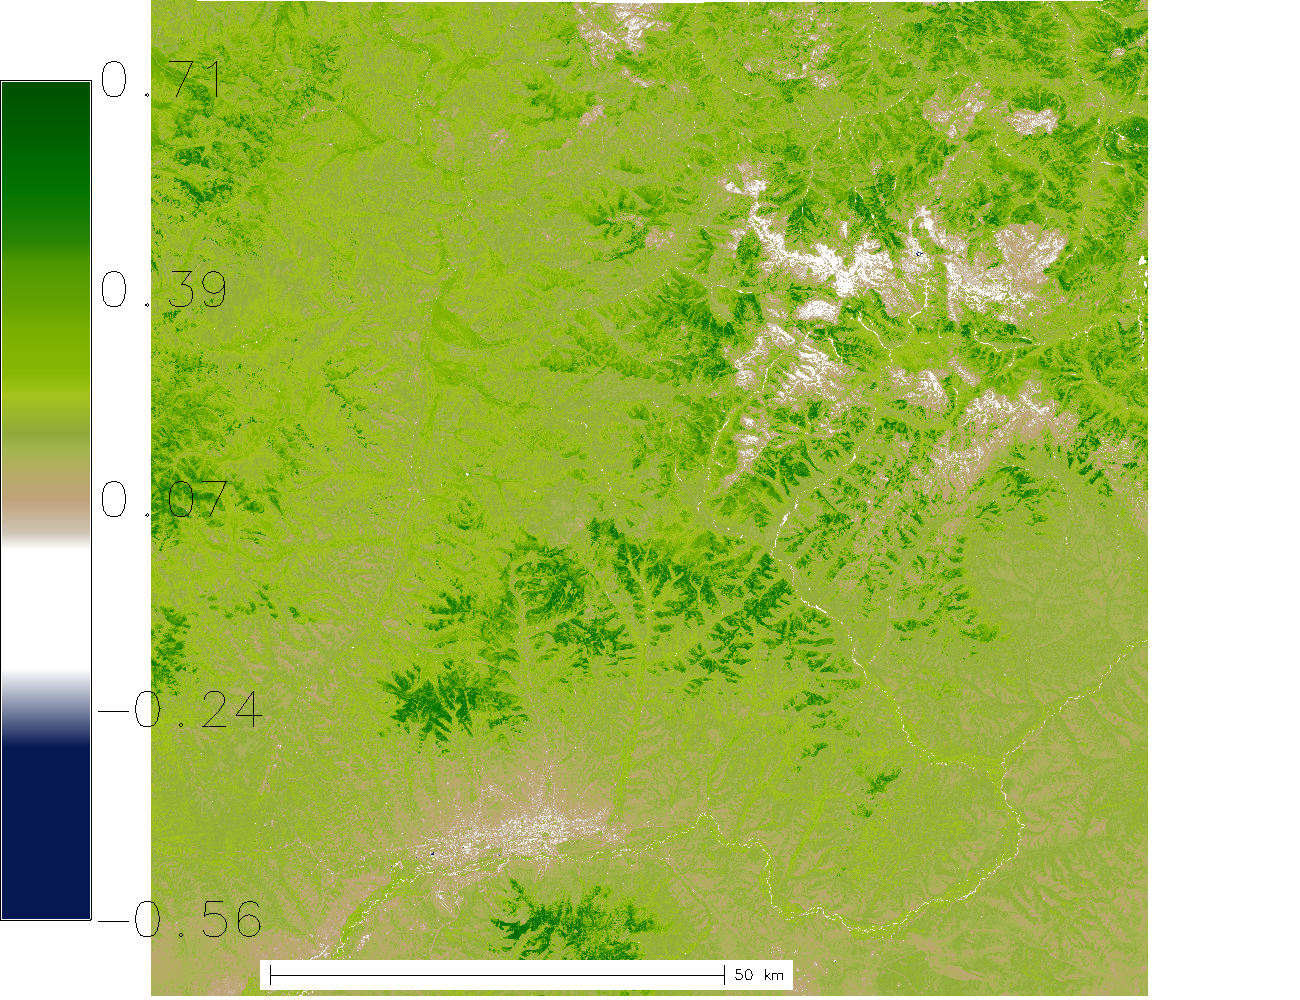
Or maybe you are more the statistics person? Then you may have seen the "process_results" section in the response above:


"process_results": [
    {
        "cells": 120900888.0,
        "coeff_var": 44.8857169907856,
        "max": 0.71156895160675,
        "mean": 0.214685931299146,
        "mean_of_abs": 0.215134492278408,
        "min": -0.561938941478729,
        "n": 120190632.0,
        "name": "ndvi",
        "null_cells": 710256.0,
        "range": 1.27350789308548,
        "stddev": 0.0963633195419669,
        "sum": 25803237.7643529,
        "variance": 0.00928588935314722
    }
],
            

This section will give you all the zonal statistics about the processed result.

Land Surface Temperature

Or if you are interested in land surface temperature data, you can query it:


            curl -u 'demouser:gu3st!pa55w0rd' \
            -X POST \
            -H  "content-type: application/json" \
            'https://actinia.mundialis.de/latest/locations/latlong_wgs84/mapsets/asia_gdd_2017/strds/gdd/sampling_sync_geojson' \
            -d '{"type":"FeatureCollection","crs":{"type":"name","properties":{"name":"urn:ogc:def:crs:EPSG::4326"}},"features":[{"type":"Feature","properties":{"cat":1},"geometry":{"type":"Point","coordinates":[96.31362348368626,35.08461626343651]}}]}'


It queries the space time raster dataset (strds) called "gdd" which means

Growing Degree Days
This layer accumulates each GDD in 2017, defined as follows: gdd = average (temperature of the day) - baseline (here: 10°C). Each type of plant or temperature driven insect needs a different amount of GDD until it blooms/hatches or will reach maturity. Due to this type of calculation, the maximum amount of growing degree days is theoretically on 31st of December but effectively reached in October on the northern hemisphere.

It then receives a point via the HTTP POST body in EPSG:4326 and the coordinates [96.31362348368626,35.08461626343651], which are somewhere in Qinghai. (Try nominatim)

With a response which looks like this:

click here to view

With this request we will get the available data for our point for every day which is registered inside the space time raster dataset. The results are inside the section "process_results". You can see a value of 0 at the beginning of the year growing up to 200 at the end of the year.

There is also data available about tropical degree days and land surface temperature minimum, maximum and average:

Land Surface Temperature
The available data from our LST archive allow to choose between medium, maximum and average temperatures for each day in the year 2017. The layer provides the basis for the two other layers 'gdd' and 'tropical days'.

Tropical Days
The layer shows each day in 2017 with nights of a minimum temperature exceeding 20 °C and hot days with a maximum temperature exceeding 35 °C, combined. With a resolution of 1km the MODIS satellites offer detailed information about tropical days in Asia.

To use them, exchange your query URL with one of the following:

Impressum - Datenschutzerklärung